We all face problems, big and small—from fixing a simple technical glitch, managing family issues, to navigating complex career decisions. But here’s the truth: problem-solving isn’t just a talent; it’s a learnable skill. Just as we use formulas to solve math problems in school, we can use structured frameworks at work and in life to find solutions. While preparing for the Services Selection Board, during high school, I got exposed to Situation Reaction Tests. At work, I learnt concepts like Lean, Six Sigma, PDCA…etc, providing me with some understanding of frameworks to solve problems. At its core, problem-solving is the process of defining a problem, identifying its root cause, generating potential solutions, and taking action to implement the best one.
Among the various approaches to problem solving & innovation, I liked the one which focusses on the people – the Design Thinking framework. It helps to solve the right problem, by putting the users at the center, generating better solutions or products, and learning quickly through real-world feedback.
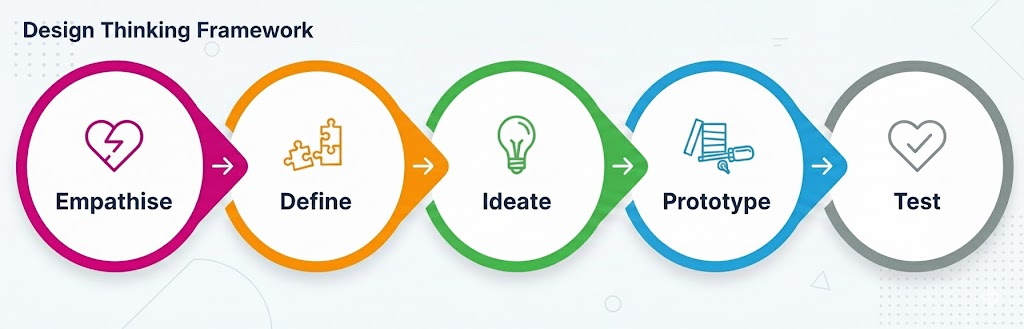
Empathise
Empathy is the foundation of effective problem-solving. It requires setting aside your own assumptions to understand the psychological and emotional needs of your users. In this phase, you aren’t just looking at data; you’re looking at lives.
Understand users’ goals, motivations, behaviours, wants, needs, challenges & frustrations.
The objective is to move beyond “what” users do and uncover why they do it. Ask yourself:
– What are they thinking and feeling?
– What makes their life miserable (pain points) and what would make it easy (gains)?
– What is meaningful to them?
What to Capture:
– Personas (The Character): Fictional profiles of typical users.
– User Journey Maps (The Story): The steps a user takes to reach a goal with your product or service. It highlights their thoughts and emotions at each touchpoint, making it easy to spot pain points and improve the experience.
Toolkit – Empathise Phase:
- User Interviews (For depth)
- Direct Observation (For truth)
- Personas (For alignment)
- User Journey Maps (For context)
- Empathy Maps (For synthesis)
- Role Playing (For perspective)
Define
Use the research data from the empathise phase, to identify the pain points. Define the who, what, and why in a sharp, actionable problem statement.
Kidlin’s Law: If you write down the problem clearly and specifically, it is already half solved.
Kidlin’s Law works because writing forces clarity. What feels overwhelming in your head becomes manageable on paper.
- The Problem Statement Formula: A great statement avoids jumping to solutions. Focus on:
- Who is experiencing the problem?
- What is the problem?
- Where the problem occurs?
- Why it matters?
- Example: “Families (Who) at the airport (Where) feel overwhelmed by the visa process (What), which ruins the start of their holiday (Why).”
- “We are experiencing [issue] in [location/time], affecting [who], resulting in [specific negative impact].”
- Deep Clarity – 5 Ws and 1 H: When a problem feels vague, use this journalistic approach to get clarity:
- What is the problem?
- Who is affected by the problem?
- Where does the problem occur?
- When did the problem start or when does it occur?
- Why is it a problem (what is the negative impact)?
- How is the problem currently being handled?
Example: Instead of saying, “The project is delayed,” you would define it as: “What: The marketing deliverable is three days late. Who: The design team is waiting on content. When: It became noticeable over the last 48 hours. Why: It will cause us to miss the product launch window.”
- Root Cause Analysis: 5 Whys & Fishbone
Symptoms are what you see; root causes are what you fix. Before you solve the problem, determine why the problem is happening. Use the 5 Whys or a Fishbone Diagram to find the Root Cause.
- The 5 Whys: This is a powerful technique for finding the root cause of a problem. Write the symptom at top; ask “Why?” five times (or as many times as it takes) until you reach a controllable cause; validate with data.
Symptom: The server crashed.- Why did the server crash? Because the application ran out of memory.
- Why did the application run out of memory? Because there was a sudden spike in traffic.
- Why was there a sudden spike in traffic? Because the advertising campaign launched early.
- Why did the advertising campaign launch early? Because the marketing and development teams weren’t coordinated. (Root Cause)
- Fishbone (Ishikawa) Diagram: Categorize potential causes under People, Process, Tech, Data, or Environment.
- Stakeholder Map: Identify who is affected (customers), who decides (owners), and who helps (enablers).
- Example: Finance ops (owners), Sales leaders (customers), IT data team (enablers).
- Example: Finance ops (owners), Sales leaders (customers), IT data team (enablers).
- SMART Goal: Turn your definition into a target. Make your desired outcome Specific, Measurable, Achievable, Relevant, and Time-bound.
- Example: “Reduce EU month-end reporting delay from 2 days to 4 hours by next quarter.”
- “Achieve [target] by [date], measured by [metric], owned by [team/person].”
Toolkit – Define Phase:
- Problem Statement Formula (For focus)
- 5 Ws and 1 H (For investigation)
- 5 Whys & Fishbone (For root causes)
- Stakeholder Mapping (For alignment)
- SMART Goals (For measurement)
Ideate
Ideation is a two-part rhythm: first, you open your mind to every possible solution (Divergent Thinking), and then you ruthlessly narrow them down to the best ones (Convergent Thinking).
- Divergent Thinking:
- Brainstorm. Just get as many ideas as possible on paper. Don’t judge or critique the ideas yet. The goal here is quantity over quality.
- Brainwriting: Participants write ideas individually for 5 minutes before sharing. This prevents the loudest person in the room from dominating the conversation.
- SCAMPER: A mental checklist to stretch your thinking:
- Substitute, Combine, Adapt, Modify, Put to another use, Eliminate, Reverse.
- Constraints Flip: Force creativity by changing the rules.
- “How would we solve this if we only had $10?”
- “If we had to deliver this in 1 hour instead of 1 week, what would we have to change?”
- Reverse Brainstorming: Ask, “How could we make this problem 10x worse?” Then, flip those “anti-solutions” to find innovative fixes.
- Convergent Thinking:
- Sort the ideas generated (Card Sorting). Find patterns, Translate ideas into insights. Use the Decision Matrix & Concept Voting, to select the best solution based on feasibility and impact.
- Impact–Effort Matrix: Map your ideas to find your Quick Wins—those high-impact solutions that require low effort.
- How Might We (HMV) Questions: Transform your heavy challenges into opportunity-focused questions. Instead of saying “The visa process is too slow,” reframe it:
- “How Might We make the visa process simpler for the whole family?”
- “How Might We remove the logistical load from the traveler?”
For complex choices, a simple Pro/Con list isn’t enough. A Decision Matrix helps you weigh options against specific criteria:
| Solution Option | Criteria 1 (Cost) (Weight: 3) | Criteria 2 (Time to Implement) (Weight: 2) | Criteria 3 (Impact) (Weight: 5) | Total Score |
| A: Buy New Tool | Score: 2 (2×3 = 6) | Score: 4 (4×2 = 8) | Score: 5 (5×5 = 25) | 39 |
| B: Re-train Staff | Score: 5 (5×3 = 15) | Score: 3 (3×2 = 6) | Score: 3 (3×5 = 15) | 36 |
(Higher scores win. Multiply the option’s raw score (1-5) by the criteria’s weight to get the final points.)
Toolkit – Ideate Phase:
- Brainwriting & Crazy 8s (For rapid ideation)
- How Might We (For reframing)
- SCAMPER (For stretching ideas)
- Impact–Effort & Decision Matrix: When you must select among several viable options.
- Miro / Slido (For collaborative digital brainstorming)
Prototype
Pilot before scale. Bring the best Ideas to life quickly, with a low-fidelity, scaled down version. Put the prototype into the hands of real users. Observe. Understand how they use, their pain points. The goal is to identify strengths and weaknesses quickly before you commit significant time, money, or resources.
The Mantra: “Fail fast to succeed sooner.”
- Low-Fidelity (Physical & Digital): Start with paper sketches, Lego/clay models, or wireframes.
- Experience Simulation (Services): If your solution is a process (like a new airport check-in flow), use Role-playing or Scenario Flows.
- Storyboarding: Draw a comic-strip version of the user’s experience to visualize how they move from the problem to the solution.
Why Prototyping Works?
- It creates alignment: It’s much easier for a team to discuss a physical model than a vague concept.
- It uncovers “Hidden” flaws: You’ll often find that what looked great on a slide deck doesn’t actually work when a human tries to use it.
- It encourages iteration: Because you haven’t spent much money yet, you aren’t “married” to the idea and are more open to changing it based on feedback.
Toolkit – Prototype Phase:
- Paper Sketches & Wireframes (For layout and flow)
- Storyboards & Scenario Flows (For the user narrative)
- Lego & Clay Models (For physical spatial awareness)
- Role-playing & Experience Simulation (For service design)
- Interactive Mockups (Using tools like Figma or InVision)
Test
Put your prototype into the hands of real users. Observe them. Don’t explain or defend your idea to the user. If they can’t figure it out on their own, the design has failed, not the user.
- Listen to frustrations: Pain points are actually “data points” for your next iteration.
- Test your assumptions: Every prototype is built on a “guess.” Testing is how you turn those guesses into facts.
- Learn & Iterate: Use the feedback to go back to the Prototype or even the Ideate phase to refine the solution.
Measuring Success – to know if your solution actually works, you need to track the right data:
- Leading Metrics (The “Now”): These are early indicators that you are on the right track.
- Example: If you are automating a report, a leading metric is the % of data sources successfully connected.
- Lagging Metrics (The “Result”): These are the final outcomes that confirm the problem is solved.
- Example: The total hours saved per month once the report is fully automated.
Closing the Loop – A solution only stays a solution if you maintain it and learn from its implementation.
- Feedback Loops: Establish weekly check-ins with your stakeholders to capture new issues or decisions as the solution scales.
- Visual Controls: Use simple dashboards or status boards so the entire team can see progress and “blockers” in real-time.
- After-Action Review (AAR): Once the project is live, gather the team and ask:
- What was expected?
- What actually happened?
- Why was there a difference?
- What will we do differently next time?
Toolkit – Test Phase:
- User Testing & Observation: Watching real people interact with your prototype.
- Pilots & Metrics: When uncertainty is high and you need evidence fast.
- A/B Testing: Comparing two versions of a solution to see which performs better.
- Surveys & Feedback Forms: Gathering quantitative data from a larger group.
- Dashboards: For visual control and real-time monitoring.
- After-Action Review (AAR) Template: For formalizing the learning process.
Don’t let analysis paralysis keep you stuck. Next time you face a challenge, grab a piece of paper and write down the four steps, then use the 5 Whys to drill down to the true cause. You’ll be surprised how quickly you move from confusion to clarity! The best thing you can do to solve a problem: Start.
If I’m gifting books to a new grad, Are Your Lights On? is my top pick for problem-solving, paired with The Design of Everyday Things for a foundation in design.
Are Your Lights On? How to Figure Out What the Problem Really Is – Donald Gause and Gerald Weinberg
This classic is a masterclass in Problem Definition. The authors argue that most failures happen not because we lack the skill to solve a problem, but because we rush to “fix” something before we truly understand it. They define a problem simply as the gap between a perceived state and a desired state. Since perceptions vary, a problem is never objective—it is personal and contextual.
The book’s philosophy is captured through two iconic examples from real events:
- The “Slow” Elevator: When tenants complained that office elevators were too slow, engineers proposed expensive motor upgrades. However, the real problem wasn’t the speed; it was the boredom of waiting. The solution? Installing mirrors next to the elevator doors. People became so occupied checking their appearance that they stopped noticing the wait entirely.
- The Lake Geneva Tunnel: The book’s title comes from events involving a long tunnel built through a mountain above Lake Geneva. At the end of the tunnel, drivers frequently forgot to turn off their headlights—especially at a scenic overlook where they stopped for sightseeing—resulting in drained batteries.
- The Technical Solution: Engineers considered an expensive automated sensor system, which was dismissed as too costly.
- The Literal Solution: A sign saying “Turn off your lights” failed at night, while a more detailed instruction—“If it’s daylight and lights are on, turn them off; if it’s dark and lights are off, turn them on”—was far too complex for drivers to process at speed.
- The “Weinberg” Solution: A sign that simply asked: “Are your lights on?” This prompted drivers to check their own situation and take the correct action.
- The Lesson: Sometimes the best solution isn’t a complex system, but a well-timed reminder that prompts the user to be mindful of their own situation.
**********
The Design of Everyday Things – Don Norman
The “Bible” of user experience. Don Norman’s core argument is simple: when users struggle with a product, the fault lies with the design, not the human. Good design is “human-centered,” matching how our brains naturally work. To achieve this, Norman introduces a toolkit of essential concepts:
- Affordances & Signifiers: An affordance is what an object can do (a handle allows pulling); a signifier is the signal that tells you to pull it. Think of a “Norman Door”—a door that looks like it should be pushed but actually needs to be pulled. Without a clear signifier, the design fails.
- Mapping & Feedback: Controls should logically align with their effects. For example, stove knobs should be arranged in the same pattern as the burners. Once an action is taken, the system must provide immediate, clear feedback (a click, a light, or a sound) so the user knows it worked.
- The Two Gulfs: Design must bridge the Gulf of Execution (how do I do this?) and the Gulf of Evaluation (did it work?).
Norman redefines “human error” by distinguishing between slips (accidental wrong actions) and mistakes (wrong plans). Instead of blaming users, designers should build in “forcing functions” to prevent errors and “undo” options to make them reversible.
Some more books on Problem Solving, suggested by Gemini
- Stop Guessing: The 9 Behaviors of Great Problem Solvers – Nat Greene
Most people try to solve problems by guessing. Greene teaches you how to actually behold the problem and stop trying to find the “fix” before you understand the “why.” - Thinking, Fast and Slow – Daniel Kahneman
Understanding System 1 (fast, intuitive) and System 2 (slow, logical) thinking. If you want to solve problems formally, you have to know when your brain is taking shortcuts that lead to errors. - Creative Confidence – Tom & David Kelley
Written by the founders of IDEO, this book is about the Ideate and Prototype phases. It’s about building the “muscle” of creativity to solve problems that don’t have a clear manual. - Thinking in Systems: A Primer – Donella Meadows
It teaches you to see the world as a series of interconnected loops. This is critical for solving “big picture” problems where a simple fix in one area might cause a collapse in another. - Algorithms to Live By: The Computer Science of Human Decisions – Brian Christian and Tom Griffiths
It applies computer science logic (like sorting, caching, and optimal stopping) to messy human problems. It’s perfect if you want a mathematical approach to everyday life. - The Goal: A Process of Ongoing Improvement – Eliyahu M. Goldratt
Introduces the Theory of Constraints. It teaches you that a problem in a system is always caused by a single “bottleneck,” and if you aren’t fixing the bottleneck, you aren’t actually solving the problem. - Learning to See – Mike Rother and John Shook
The definitive guide to Value Stream Mapping. If you want to solve problems in a workflow, you have to be able to map where the “waste” is.
Lean Problem Solving
Lean philosophy was popularized by Toyota. Eliminating waste & maximize value.
Resources: Time, Money, People.
Problem: Deviation from the standard or expectation
Problem solving is a structured activity to get a process back to achieving the standard
7 types of waste (TIMWOOD+1)
– Transport
– Inventory
– Motion
– Waiting
– Over-processing
– Over-producing
+ Intellect
Just In Time: Trouble shooting. Just do it.
(Might take mins)
Level 0: Foundation of problem. Investigating non adherence to standards. 4 steps.
(Might take hours)
Step 1: Problem Definition
Step 2: Process Verification
Step 3: Root Cause Identification
Step 4: Counter measures & process confirmation
Methods: PDCA , (Plan, Do Check, Act) Go & See, Checklists, 5 Whys
Practical Problem Solving: If L0 fails to solve the problem, then move to PPS. 8 steps
(Might take days)
Step 1: Clarify the problem
Step 2: Identify the point of cause
Step 3: Set the target
Step 4: Cause and effect(brainstorming) and root cause investigation
Step 5: Identify the countermeasures
Step 6: Implement countermeasures
Step 7: Check results
Step 8: Standardise and share
6 Sigma: Used to solve highly complex issues. DMAIC.
(Might take weeks)
Define the Customer critical parameters
Measure how the process performs
Analyse the causes of the problem
Improve the process to reduce defects/variability
Control process to ensure sustained improvement
Please click & expand for a wealth of resources & the references
- Problem Solving – Pinterest Board
- How You Define the Problem Determines Whether You Solve It – HBR
- The Power of Leaders Who Focus on Solving Problems – HBR
- Solve Any Problem by Kidlin’s Law
- Kidlin’s Law: The Key to Solving Your Hardest Project Problems
- Problem Solving – Untools
- Design Thinking 101
- The CIRCLES Method
- How to Build a Problem Statement
- https://www.instagram.com/reel/DRfHPS1gJvz/
- https://www.instagram.com/p/DVJuriJiI_X/
- https://www.instagram.com/p/DQdIryODaFn/
- https://www.lean.org/explore-lean/problem-solving/
- https://www.gembaacademy.com/resources/gemba-glossary/practical-problem-solving
- https://www.beyondlean.com/problem-solving.html
- Do Things that Don’t Scale
- Lean Manufacturing
- 5S Methodology
- Muda
- Kaizen
