We all face problems, big and small—from fixing a simple technical glitch, managing family issues, to navigating complex career decisions. But here’s the truth: problem-solving isn’t just a talent; it’s a learnable skill. Just as we use formulas to solve math problems in school, we can use structured frameworks at work and in life to find solutions. While preparing for the Services Selection Board, during high school, I got exposed to Situation Reaction Tests. At work, I learnt concepts like Lean, Six Sigma, PDCA…etc, providing me with some understanding of frameworks to solve problems. At its core, problem-solving is the process of defining a problem, identifying its root cause, generating potential solutions, and taking action to implement the best one.
Among the various approaches to problem solving, I liked the Design Thinking framework. It’s human-centered, creative, and pragmatic, helping you solve the right problem, generate better solutions or products, and learn quickly through real-world feedback.
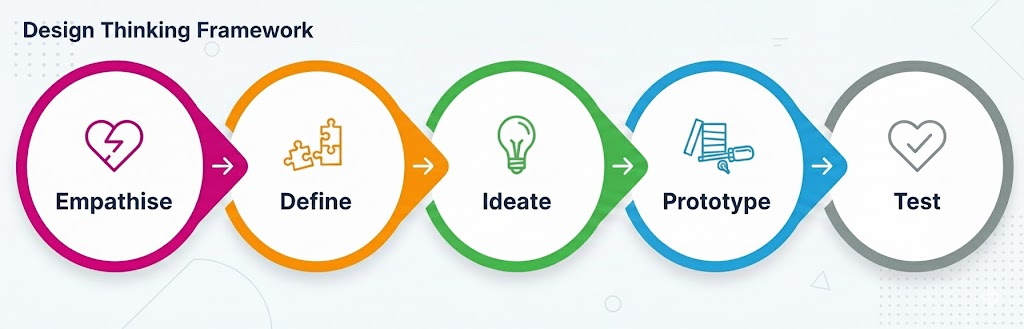
Empathise
Understand users, their needs & pain points. Review data & identify problems. Collect feedback continuously. Tools: User Interviews, Observations, Personas, User Journey Maps, Role Plays.
Define
Clearly define the core problem, for whom & why. Write the problem statement.
Kidlin’s Law: If you write down the problem clearly, then the matter is half solved.
Kidlin’s Law works because writing forces clarity. Putting a problem on paper helps you understand it better and find solutions faster. What feels overwhelming in your head becomes manageable on paper.
- Problem Statement: Focus on the Who/What/Where/When/Impact without jumping to solutions.
- Example: “Sales reporting is delayed by two days each month for the EU region, causing leadership to miss early-trend decisions.”
- SMART Goal: Make your desired outcome Specific, Measurable, Achievable, Relevant, and Time-bound.
- Example: “Reduce EU month-end reporting delay from 2 days to 4 hours by next quarter.”
- Stakeholder Map: Identify who is affected (customers), who decides (owners), and who helps (enablers).
Tool for Defining the Problem: The 5 Ws and 1 H
When a problem feels vague, use this journalistic approach to get clarity:
* What is the problem?
* Who is affected by the problem?
* Where does the problem occur?
* When did the problem start or when does it occur?
* Why is this a problem (what is the negative impact)?
* How is the problem currently being handled?
Example: Instead of saying, “The project is delayed,” you would define it as: “What: The marketing deliverable is three days late. Who: The design team is waiting on content. When: It became noticeable over the last 48 hours. Why: It will cause us to miss the product launch window.”
Find the Root Cause. Determine why the problem is happening. Symptoms are what you see; root causes are what you fix.
- The 5 Whys: Ask “Why?” repeatedly until you reach a process or behavioral cause.
- Fishbone (Ishikawa) Diagram: Categorize potential causes under People, Process, Tech, Data, or Environment.
Tool for Analyzing the Cause: The 5 Whys
This is a powerful technique for finding the root cause of a problem. You simply ask “Why?” five times (or as many times as it takes) in response to the preceding answer.
1. Why did the server crash? Because the application ran out of memory.
2. Why did the application run out of memory? Because there was a sudden spike in traffic.
3. Why was there a sudden spike in traffic? Because the advertising campaign launched early.
4. Why did the advertising campaign launch early? Because the marketing and development teams weren’t coordinated. (Root Cause)
Ideate
Generate as many creative ideas as possible.
Tools: Brainstorming. Miro, Slido.
Tool for Developing Solutions: Brainstorming (The Divergence Phase)
Once you know the root cause, you need options. Follow these rules for effective brainstorming:
* Quantity over Quality: The goal is to generate as many ideas as possible.
* No Judgment: Critiquing ideas is banned during the generation phase.
* Build on Others: Combine or expand on existing suggestions.
Tool for Selecting the Best Solution: The Decision Matrix
For complex choices, a simple Pro/Con list isn’t enough. A Decision Matrix helps you weigh options against specific criteria:
| Solution Option | Criteria 1 (Cost) (Weight: 3) | Criteria 2 (Time to Implement) (Weight: 2) | Criteria 3 (Impact) (Weight: 5) | Total Score |
| A: Buy New Tool | Score: 2 (2×3 = 6) | Score: 4 (4×2 = 8) | Score: 5 (5×5 = 25) | 39 |
| B: Re-train Staff | Score: 5 (5×3 = 15) | Score: 3 (3×2 = 6) | Score: 3 (3×5 = 15) | 36 |
(Higher scores are better. Multiply the Option’s Score by the Criteria’s Weight to get the Weighted Score.)
The best problem-solving technique is simple: Start.
Don’t let analysis paralysis keep you stuck. Next time you face a challenge, grab a piece of paper and write down the four steps, then use the 5 Whys to drill down to the true cause. You’ll be surprised how quickly you move from confusion to clarity!
Generate Options
This is the “Divergent” phase. Don’t judge ideas yet; just get them on paper.
Constraints Flip: Ask, “If we had to deliver this in 1 hour instead of 1 week, what would we have to change?”
Brainwriting: Participants write ideas individually for 5 minutes before sharing. This prevents the loudest person in the room from dominating the conversation.
SCAMPER: Use these prompts to stretch your thinking:
Substitute, Combine, Adapt, Modify, Put to another use, Eliminate, Reverse.
Decide and Plan
Once you have 5–8 options, it’s time to narrow them down.
Impact–Effort Matrix: Map your ideas to find “Quick Wins” (High Impact, Low Effort).
Decision Matrix: Score your options against weighted criteria.
Prototype
Bring Ideas to life quickly. Get prototypes into users’ hands early, to test, learn & iterate.
Tools: Paper Prototype/Wireframes, Lego, Clay.
Test
Don’t roll out a massive change all at once. Observe real users interacting with the prototype. Understand their experiences & pain points to refine the solution. Pilot, then scale.
- Leading Metrics: What can we measure now to see if we’re on track? (e.g., % of data sources connected).
- Lagging Metrics: What is the final result? (e.g., final hours to publish the report).
- Visual Controls: Use simple dashboards so the team can see progress in real-time.
Learn and Embed
To prevent the problem from returning, you must “lock in” the solution.
- After-Action Review (AAR): Ask: What was expected? What actually happened? Why? What will we do next time?
- Standard Work: Document the new process and retire the old method entirely to avoid backsliding.
- Change Reinforcement: Update onboarding checklists so new hires learn the “new way” from Day 1.
🖋️ The Problem Statement Formula
“We are experiencing [issue] in [location/time], affecting [who], resulting in [specific negative impact].”
🎯 The SMART Goal Formula
“Achieve [target] by [date], measured by [metric], owned by [team/person].”
Refs:
https://hbr.org/2017/06/how-you-define-the-problem-determines-whether-you-solve-it
https://x.com/bandanjot/status/1710190242488074535
https://medium.com/eightshapes-llc/how-to-build-a-problem-statement-d1f21713720b
https://www.instagram.com/reel/DRfHPS1gJvz/
https://www.instagram.com/reel/DRHYtSHjbV4/?igsh=cGJiZHFrOWUxdnRw
https://medium.com/@hhuseyincosgun/solve-any-problem-by-kidlins-law-4cb5ab67fd7
https://www.davidhager.ch/the-human-side-of-project-management/kidlins-law-the-key-to-solving-your-hardest-project-problems
